
About EPIPOI
Common analytical tools often lack methods relevant to time-series, forcing users to either defer to more experienced users or be confronted with the steep learning curve of coding their own functions. We believe that such complexity is meant for programmers and not users, who should be principally concerned with extracting and interpreting the maximal information from their data. EPIPOI makes such techniques available without requiring special mathematical knowledge.
EPIPOI offers users the opportunity to extract seasonal parameters from time-series, examine trends and identify unusual periods (for example epidemic peaks). Users are encouraged to visualize these parameters in the context of geographic variation to identify possible relationships in both space and time.
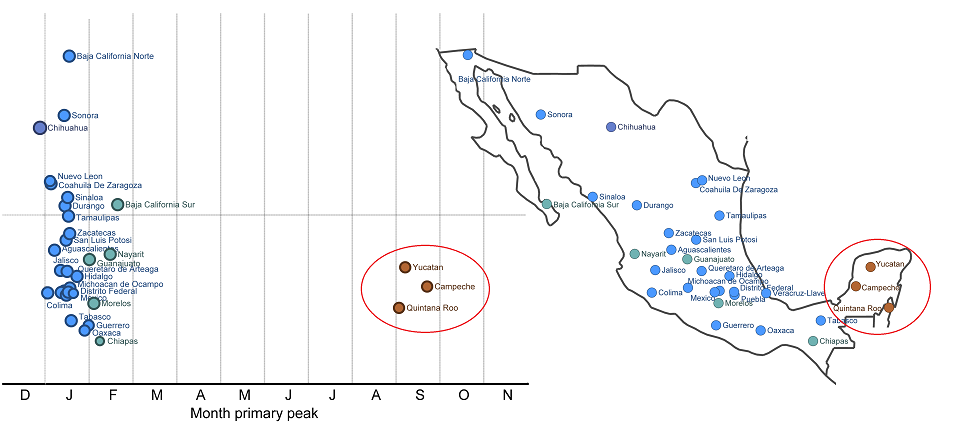
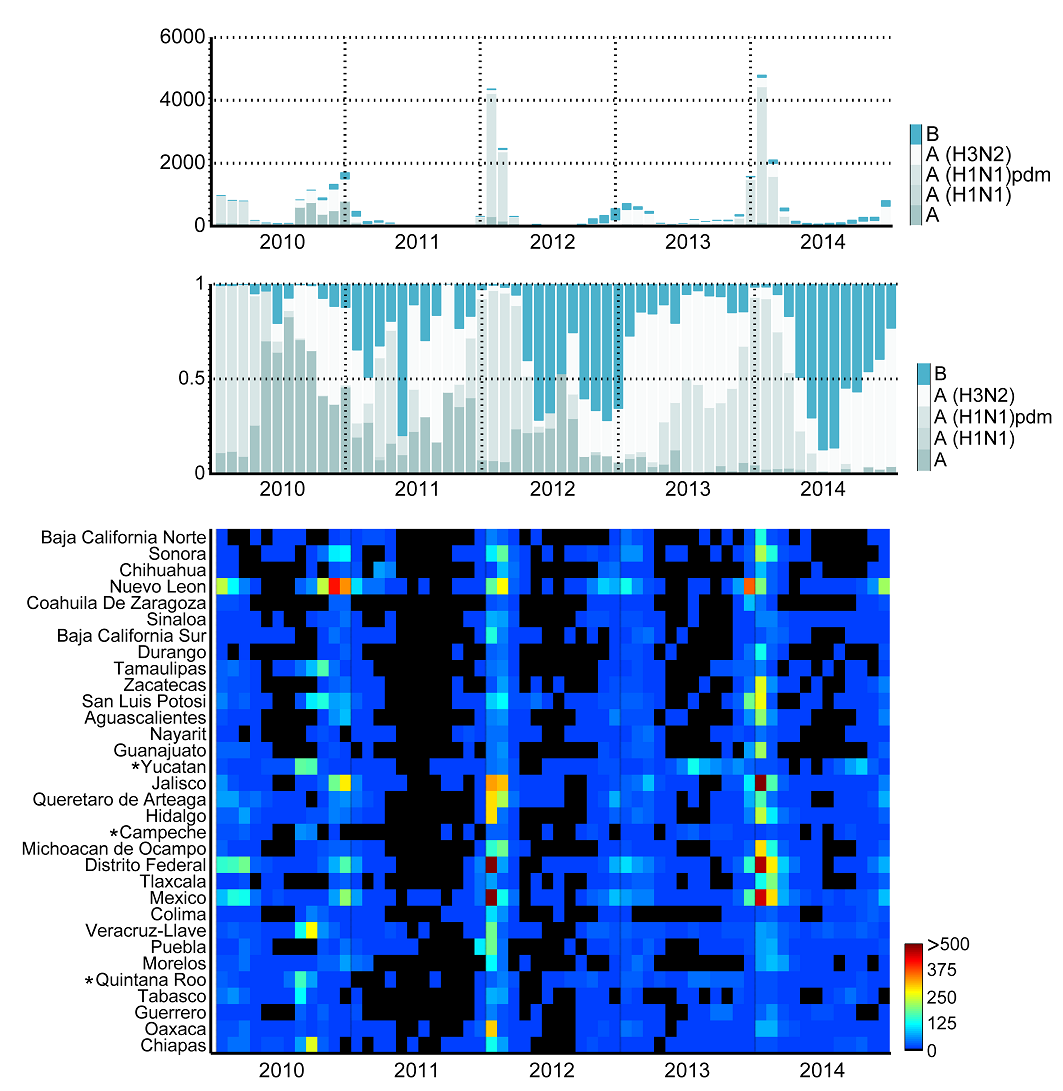
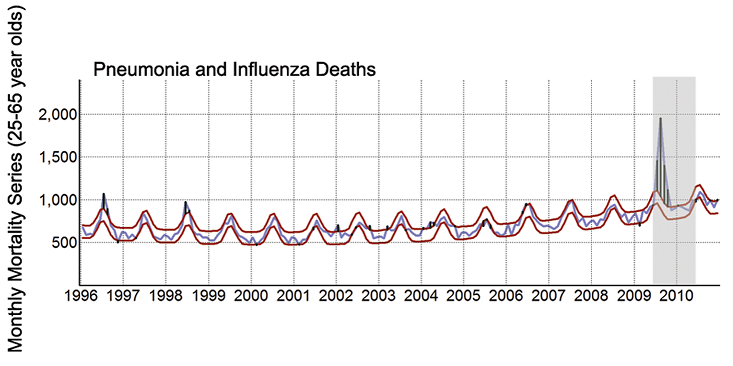
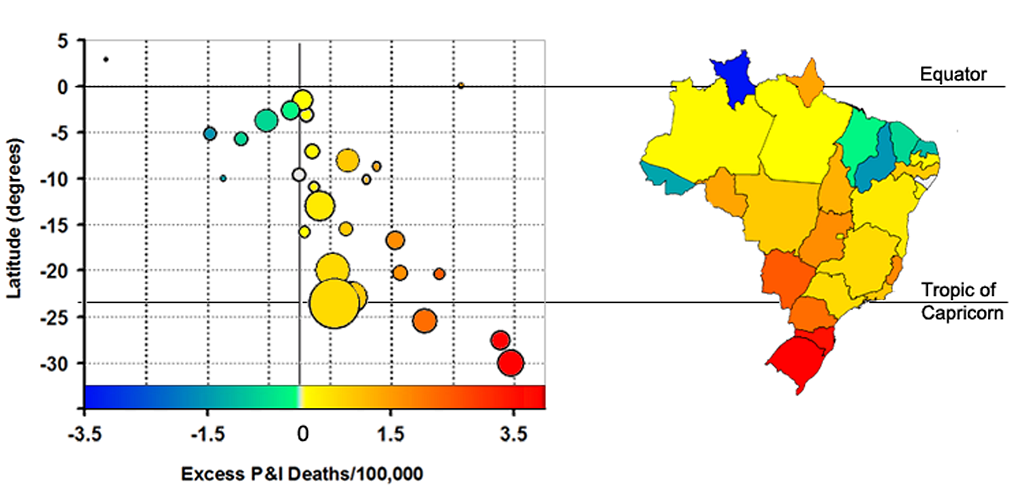
One of the analytical possibilities of Epipoi is the visualization and quantification of seasonal parameters. Here we can see some examples from a Brazilian and a Mexican performed with epipoi