
Flunet
Flunet data prepared and ready for analyses in Epipoi
Flunet dataset prepared for the study
Alonso, W. J. et al. 2015 A global map of hemispheric influenza vaccine recommendations based on local patterns of viral circulation. Sci. Rep. 5, 17214
Countries send their influenza surveillance data to the World Health Organization (WHO), which compiles it and make it publicly available at the the FluNet database, the global influenza surveillance system maintained by WHO (http://www.who.int/influenza/gisrs_laboratory/flunet/en). We organized the data in a format ready to be loaded and analyzed in the free spatio-temporal analytical software Epipoi. The information is organized using rows for time (the data was aggregated by month), columns for geography (the spatial units used were the original from the dataset: countries) and spreadsheets for virus type (again using the maximum resolution available in the original dataset: H1N1, H1N1pdm09, AH5, H3N2, B and unsubtyped):
Flunet_1995_2014_for_Epipoi.xls
In addition to the previous file, Epipoi needs the following one (which is going be requested after the previous one is loaded in the program) containing the latitudes and longitudes of the capitals of the countries (a geography point representing each place is needed for Epipoi performing the spatial analyses):
(after loading these files epipoi will ask “Do you have interporlated population data …?”. Just click “No” and wait until the data is loaded and now you will be ready to inspect the data.
The following figure shows how data is visualized just after being loaded in Epipoi (and selecting those years):
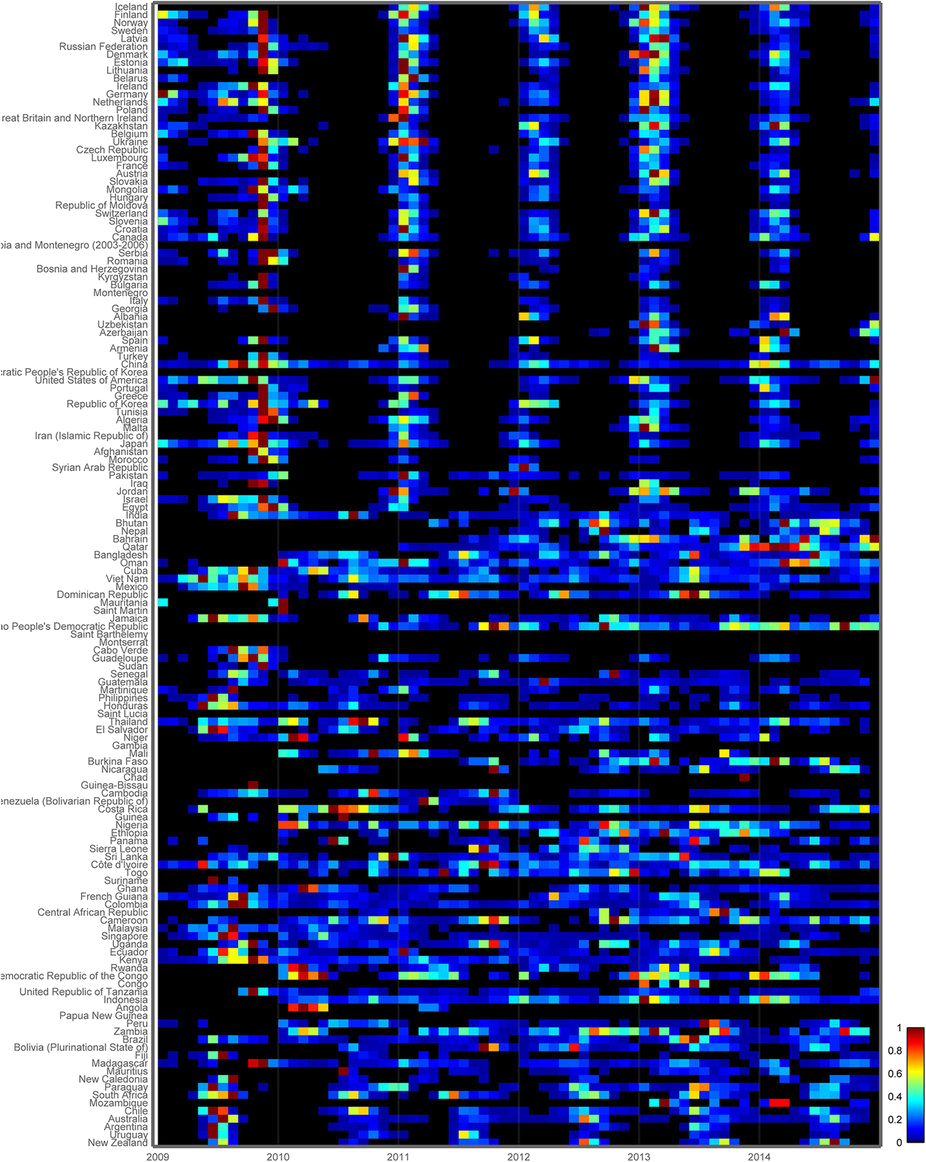
For this dataset I suggest to begin by selecting only the years 2010 to 2014, and then click on the “Seasonality” option, and then “Scattplots”. By doing so you will have the generated the basic scatter plot for figure 1 of the paper. Note that the figure of the article was edited in order the sequence of months start in December. Boxes, arrows, etc were added after exporting the figure – what you can do clicking the relevant “Export figures” button in Epipoi)
We encourage you to keep exploring the other analytical possibilities in the program, and also selecting only the countries, flu strains and/or years of your interest, in order to further investigate this dataset in ways and aspects you might be particularly interested.